European car market 2026: what the figures mean for your transport flows
· 6 min read · Updated on
The first half of 2026 shows a European market growing moderately but reshaping fast: electric is gaining ground, some national markets are accelerating, and the used-car market is tightening. For a dealer, a rental company or a remarketing platform, these movements translate very concretely into vehicles to move. Here is the operational read.
Moderate growth, but very uneven across countries
In the first half of 2026, new car registrations in the EU reached 5.90 million units, up 5.7% (source: ACEA). June alone rose 13.6%.
But the average hides wide gaps. Germany posted 1.48 million units in H1 (+5.8%), France +2.65% year-to-date with July at +9%, while Belgium slipped slightly (−1.7% by volume) and the Netherlands by 4%. These gaps determine the real direction of flows: it is the imbalance between markets that creates the need for transport.
Electric crosses thresholds that change handling
Across the EU, battery-electric reached 20.7% market share in H1 2026, up from 15.6% a year earlier. In France, July peaked at 35% electric of registrations (+127% year on year). In Denmark, electric accounts for nearly 80% of the new car market.
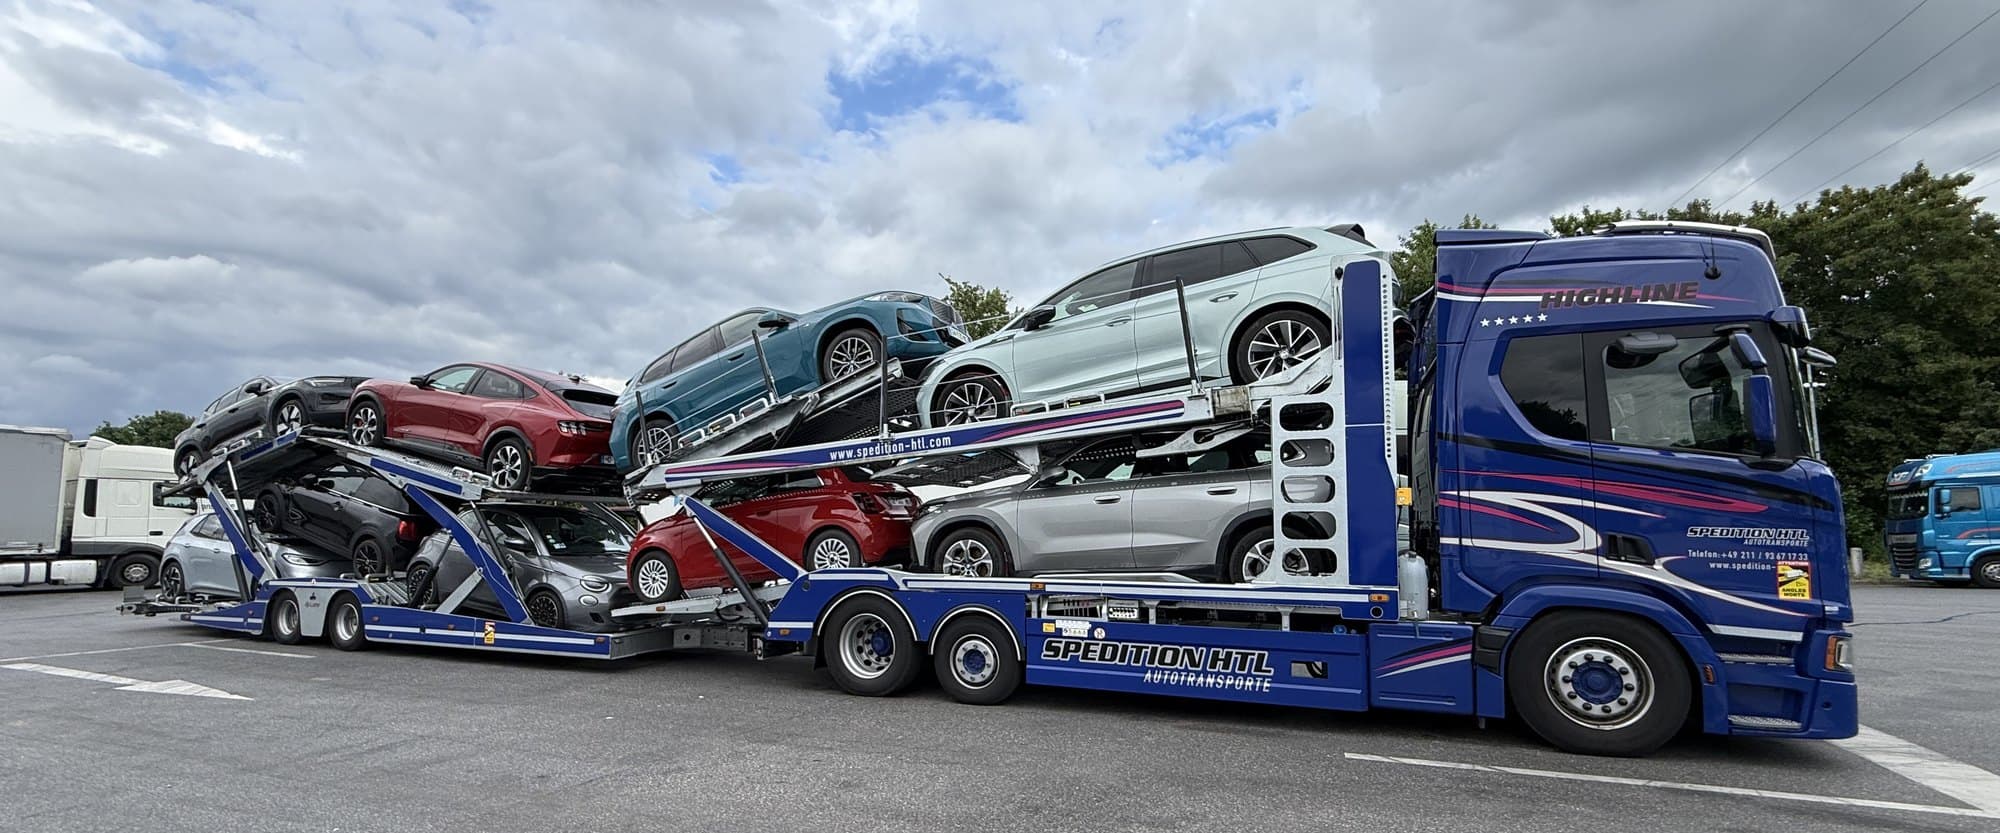
For transport this is not neutral: an electric vehicle is heavier than an equivalent combustion model, which weighs on the car carrier payload and therefore on units per load. State-of-charge and safety instructions add to the preparation.
The used-car market is tightening — visible in remarketing flows
The used-car market is clearly under strain. Leasing group Ayvens reported a used-car result of −€8m in Q2 2026, against +€143m a year earlier — a €151m swing in one year. In France, used-car transactions fell 4% in July.
Residual value forecasts for 2026 confirm the trend: only the Netherlands, Sweden and Finland are expected in positive territory, with Italy remaining the main downside risk. Practical consequence: fleet return flows are reorganising, selling times are lengthening, and repositioning logistics becomes a more sensitive item.
What this concretely implies for your transports
Three operational consequences. First, north-south and east-west corridors are becoming unbalanced: a market growing faster than its neighbour pulls supply flows — and often creates empty returns to avoid.
Second, the rising share of electric means anticipating weight and charging instructions from the quote request onwards. Third, a harder used-car market pushes to shorten the time between decision and delivery: every day in stock costs more when residual values fall.